
Supplier lead time variability — The contract says fourteen days. The mean is sixteen. The ninetieth percentile is twenty-nine. Your safety stock was calculated from the first number.
Supplier lead time variability: bu ne anlama geliyor
Every planning system holds a lead time field. It contains one number, usually the contractual one, occasionally an average. Neither describes what actually happens.
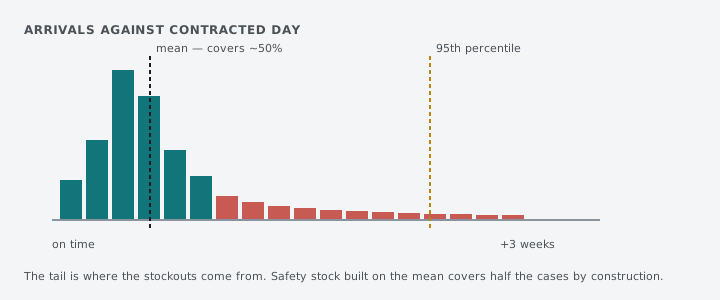
Delivery performance is a distribution, and it is rarely symmetric. Suppliers are seldom early and occasionally very late. The tail is where stockouts come from.
What using the mean costs
Safety stock calculated from an average lead time covers roughly half the cases by construction. The other half are absorbed by expediting, substitution and stockouts — costs that land in different budgets and are never attributed back to the lead time assumption.
What the data already supports
Most ERPs hold the receipt history. The distribution can be computed from data you already have, per supplier and per material.
Once lead time is a distribution, safety stock becomes a service-level decision rather than a formula, and an agent can make it per line — conservative where the tail is long, lean where the supplier is reliable. That is a meaningful working-capital difference from data nobody had to collect.
Computing it is a day of work
Receipt date minus order date, grouped by supplier and material, over two years. Every ERP holds both fields.
What comes back is rarely a tidy curve. A typical supplier shows a tight cluster around the contractual date and a scattering of arrivals one to three weeks late, often concentrated in particular months or particular materials.
The scatter is the useful part. An average computes to something respectable and describes none of the actual behaviour.
What the shape tells you
A narrow distribution means the contractual number is real and safety stock can be lean. This is the case people assume and it is less common than assumed.
A long right tail means the mean is meaningless and the service level has to be set against a percentile. Covering the 95th rather than the 50th is often only a few days more stock, because the tail is thin — the cost of the assumption was never the inventory, it was the expediting.
A bimodal distribution means two things are happening under one supplier code: two plants, two shipping modes, or a material that is sometimes made to order. Splitting the code is worth more than any modelling.
Where the cost currently lands
Not in the planning department that set the lead time. In expediting freight, in substitution scrap, in the line that stopped, and in the customer service credit.
None of these are attributed back to the assumption that produced them, which is why an obviously wrong lead time field can sit unchanged for years while its consequences are managed as separate operational problems.
Making it a per-line decision
Once the distribution exists per supplier and material, safety stock stops being a formula applied uniformly and becomes a choice with a stated service level.
An agent can then hold cover against the 90th percentile on a critical component from an unreliable supplier and the 60th on a commodity from a reliable one. The total working capital often falls while availability rises, because the uniform policy was simultaneously over-covering the reliable lines and under-covering the risky ones.
The supplier conversation this enables
A distribution is evidence in a way an anecdote is not. “You were late four times last quarter” invites disagreement about which four. “Your delivery performance against contract is 71% with a median overrun of nine days on this material” does not.
Several organisations find the measurement changes supplier behaviour before any inventory policy does.
The field to fix first
Not the model. The lead time field itself, which in most systems still holds the number entered when the supplier was onboarded.
Replacing it with a measured median is an afternoon’s work and improves every calculation downstream of it, before any distribution work begins.